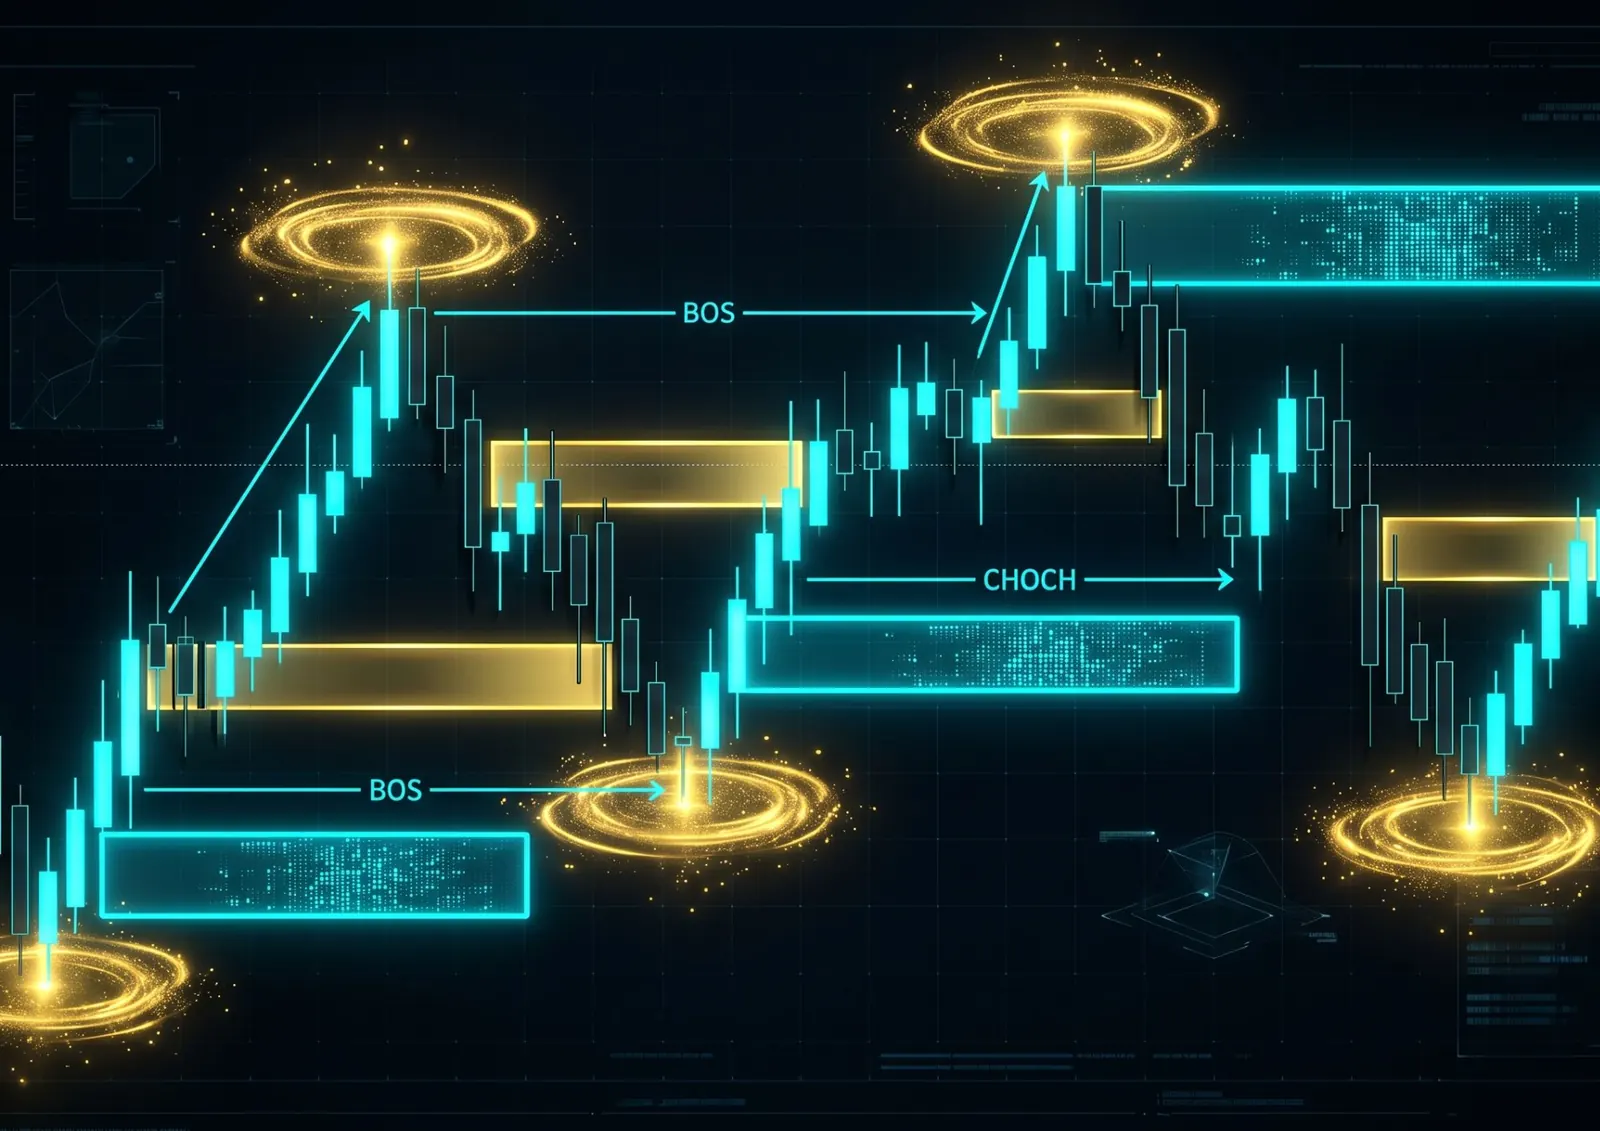
Most trading education teaches you to draw lines on charts and hope price bounces. Support. Resistance. Moving averages. RSI. These tools are not useless — but they share a fundamental problem: they describe what already happened. They do not explain why price moves. They do not reveal who is moving it. And they do not tell you what is going to happen next.
Smart Money Concepts (SMC) does something different. It attempts to explain market movement from the perspective of the entities that actually control it — institutional traders, market makers, and large capital operators — and then gives you a framework to trade in alignment with their activity rather than against it.
This article is the complete SMC framework. Every core concept explained from scratch, in sequence, with exactly how each one connects to the next and how to combine them into a single coherent trading system.
1. The Foundation — Why Markets Move the Way They Do
Before any concept, you need the correct mental model. Most retail traders believe price moves because of supply and demand. That is partially true. But it misses the most important actor in the room.
Price in any liquid market is ultimately controlled by market makers — entities whose business model is to provide liquidity to all other participants. They buy when you sell. They sell when you buy. And they are not doing this as a charity. They profit from the spread and from knowing, at any given moment, exactly where retail stop losses and pending orders are clustered.
Stop thinking of the market as a crowd where price emerges from collective behavior. Start thinking of it as a chess game with one very large player — the market maker — who can see all the pieces on the board and is actively moving price to maximize their own profit. Every SMC concept is a way of reading their moves before they make them.
With that mental model established, the five core SMC concepts are not just patterns to memorize — they are windows into the market maker's playbook. Here is the full framework.
2. Market Structure — The Language Price Speaks
Market structure is the foundation of everything in SMC. Before you identify a single Order Block or Fair Value Gap, you must know what direction the market is moving in — and on which timeframe that movement is meaningful.
The Four Building Blocks of Structure
Price movement on any timeframe follows a consistent pattern of swings. These swings create four reference points that define whether the market is bullish, bearish, or transitioning:
HH
╱ ╲ HH
HL ╱ ╲╱
╱ HL
→ HH = Higher High | HL = Higher Low
→ As long as structure makes HH and HL, bias is BULLISH
BEARISH STRUCTURE (downtrend):
LH
╲ LH
LL ╱ ╲
LL
→ LH = Lower High | LL = Lower Low
→ As long as structure makes LH and LL, bias is BEARISH
Never trade against higher timeframe structure. If the Daily chart is making Lower Highs and Lower Lows, no 1H bullish setup is worth taking at full size. The daily structure is the river's current. The 1H setup is a fish trying to swim upstream. Possible — but unnecessarily hard.
3. Break of Structure (BOS) — Trend Confirmation
A Break of Structure (BOS) occurs when price closes beyond a significant swing high or swing low, confirming that the current trend is continuing. It is not a reversal signal — it is a trend continuation confirmation.
Bullish BOS
In an uptrend, a Bullish BOS happens when price breaks above the previous significant swing high with a strong candle close. This confirms the Higher High is legitimate — institutions are still buying — and the trend is intact.
Bearish BOS
In a downtrend, a Bearish BOS happens when price breaks below the previous significant swing low with conviction. The Lower Low is confirmed. Sellers remain in control.
██ ← Swing High (Previous HH)
██ ╱╲ ╱
╱╲ ╱ ╲╱
╱╲ ╱╲╱
████████ ← BOS: Close above previous HH
↑ CONFIRMED BULLISH — Continue buying pullbacks
Not every break of a swing high is a real BOS. For a BOS to be valid in SMC, you need a candle close beyond the level — not just a wick. Wicks that briefly pierce a level and immediately reverse are liquidity sweeps (covered in our previous article), not Break of Structure signals.
4. Change of Character (ChoCH) — The Earliest Reversal Warning
If BOS confirms the trend is continuing, Change of Character (ChoCH) is the earliest signal that the trend may be ending. It is the most important concept in SMC for catching reversals early — and the most commonly misidentified.
What ChoCH Looks Like
In an uptrend making Higher Highs and Higher Lows: a ChoCH occurs when price breaks below the most recent Higher Low. Not the overall trend low — the most recent HL in the sequence. This is the first crack in the bullish structure. It does not confirm a reversal yet — but it puts you on alert.
In a downtrend making Lower Highs and Lower Lows: a ChoCH occurs when price breaks above the most recent Lower High. The first sign that sellers may be losing control.
HH2
HH1 ╱ ╲
╱ ╲╱ HL2
HL1
╲ ← Price drops below HL2
↓ ChoCH — Structure violated for first time
WHAT HAPPENS NEXT (if confirmed):
LH (Lower High forms on bounce)
╲ LL (Lower Low confirms — trend reversed)
← BOS down confirms new downtrend structure
Break of Structure
Price closes beyond a significant swing high/low in the direction of the existing trend. Confirms the trend is continuing. Use it to add to existing positions or re-enter on the next pullback with high confidence.
Change of Character
Price breaks the most recent swing in the opposite direction of the trend — the first structural violation. Early warning of potential reversal. Does not confirm reversal alone — wait for a BOS in the new direction for confirmation.
5. Fair Value Gaps (FVG) — The Imbalance That Must Be Filled
A Fair Value Gap (FVG) is one of the most actionable concepts in SMC. It is also one of the simplest to identify visually — once you know what you are looking for.
What Creates an FVG
When price moves very rapidly in one direction, the buying and selling between candles becomes so imbalanced that a gap in price coverage forms. This gap — the zone between the top of candle 1 and the bottom of candle 3 in a three-candle sequence — is the Fair Value Gap. No meaningful two-way trading happened at these prices. The market "skipped" through this zone.
Candle 1 │ Candle 2 │ Candle 3
████ │ │
████ │ ████████ │
████ │ ████████ │ ████ ← Low of Candle 3
│ │ ← FVG ZONE (gap between C1 high and C3 low)
│ │
│ │ ████ ← High of Candle 1
FVG = the space between [High of Candle 1] and [Low of Candle 3]
Price tends to return and at least partially fill this gap before continuing
Why FVGs Get Filled
Markets seek efficiency. A price level where no meaningful trading occurred is, by definition, an inefficiency. Institutions with large orders often use these return-to-FVG moments to fill the remainder of their positions — which is why price so frequently gravitates back to these zones before resuming the original move.
The most powerful FVG entries occur when an FVG sits inside an Order Block on the same timeframe. This confluence — imbalance (FVG) + institutional footprint (OB) in the same zone — is one of the highest-probability SMC setups that exists. When price returns to a zone with both, treat it as a premium entry.
6. Order Blocks — Where Institutional Money Entered
We covered Order Blocks in depth in a dedicated article. Here is the essential version within the complete framework.
An Order Block (OB) is the last opposing candle before a strong impulsive move. It marks the precise level where institutions placed large orders — and where unfilled portions of those orders still wait, making the zone a high-probability reversal area when price returns to it.
Last Bearish Candle Before Rally
The final red candle before a strong impulsive move upward. When price returns to the range of this candle, institutions are likely to defend it. Entry zone for long positions. Most powerful when combined with an FVG in the same area.
Last Bullish Candle Before Drop
The final green candle before a strong impulsive move downward. When price retraces into this candle's range, institutions are likely to sell again. Entry zone for short positions. Higher probability when aligned with HTF bearish structure.
Within the complete SMC system, Order Blocks are your entry tools — not your directional bias tools. Structure and ChoCH tell you which direction to trade. Liquidity pools tell you where price is going. FVGs tell you where price will pause. Order Blocks tell you the exact candle zone where you enter. Each concept plays a specific role.
7. Liquidity Pools — Where Price Is Actually Going
This is the concept most SMC traders learn last — but should learn first. Liquidity pools are the destination of institutional price movement. Understanding them answers the question that most traders cannot: where is price going next?
What Is Liquidity?
In financial markets, liquidity means orders — specifically, the orders of other market participants that an institution can use to fill its own large positions. Stop losses placed by retail traders are, from an institutional perspective, buy or sell orders sitting at predictable price levels. Market makers need these orders. So they engineer price to collect them.
- Sits above swing highs and recent peaks
- Formed by: retail short sellers' stop losses + breakout buyers' pending orders
- Institutions push price UP to collect BSL before reversing down
- When BSL is swept, look for bearish reversal immediately after
- Example: price spikes above previous week's high, reverses sharply
- Sits below swing lows and recent troughs
- Formed by: retail long traders' stop losses + breakdown sellers' pending orders
- Institutions push price DOWN to collect SSL before reversing up
- When SSL is swept, look for bullish reversal immediately after
- Example: price dips below previous day's low, immediately recovers
Every swing high has retail short sellers' stop losses sitting just above it. Every swing low has retail long traders' stop losses sitting just below it. Market makers know exactly where these stops are — because the stops are at the most obvious price levels. Price moves to these levels to trigger the stops (collecting the liquidity), then reverses. You have experienced this as "the market went exactly to my stop and reversed." That was not bad luck. That was the plan — the same mechanic we break down in full in our dedicated article on liquidity sweeps and stop hunts.
Equal Highs and Equal Lows — Premium Liquidity Targets
When price creates two or more swing highs or lows at the exact same level, it is called Equal Highs (EQH) or Equal Lows (EQL). These are premium liquidity targets — obvious levels where retail stops are concentrated in even higher quantities than a single swing. Institutions target these with high frequency.
8. Premium vs Discount Zones — The Optimal Entry Framework
This concept connects everything into a precise entry methodology. It answers: within the Order Block, exactly where do I enter?
The Range Midpoint (Equilibrium)
Any price range — whether a daily swing, a weekly range, or an Order Block — has a midpoint called the Equilibrium (EQ). This is the 50% level of the range.
Prices above the EQ are in the Premium Zone — expensive relative to the range. Institutions sell in premium zones. Prices below the EQ are in the Discount Zone — cheap relative to the range. Institutions buy in discount zones.
╔═══════════════════════════╗ ← PREMIUM ZONE
║ Institutional SELL zone ║
║ Bearish OBs live here ║
EQUILIBRIUM ══════════════════════════════ 50%
║ Institutional BUY zone ║
║ Bullish OBs live here ║
╚═══════════════════════════╝ ← DISCOUNT ZONE
RANGE LOW ───────────────────────────── 0%
OPTIMAL TRADE ENTRY (OTE): 62%–79% into the discount zone (for longs)
This is the Fibonacci 0.62–0.79 retracement of the most recent swing
9. The Complete SMC Trade Setup — All 5 Concepts Working Together
This is what you came for. Here is exactly how the five concepts chain together into a single, complete trade setup — from macro context to precise entry.
10. The Multi-Timeframe Hierarchy — Which Chart Rules
SMC requires trading across multiple timeframes simultaneously. Here is exactly which timeframe controls which decision:
| Timeframe | Role in SMC | What You Look For | Decision Made |
|---|---|---|---|
| Weekly / Daily | Macro Bias | HH/HL or LH/LL sequence, ChoCH signals | Long-only or Short-only this week |
| 4H | Intermediate Structure | Liquidity pools, major OBs, BOS confirmations | Which liquidity pool is the current target |
| 1H | Entry Zone Identification | Order Blocks, FVGs, premium/discount zones | The exact price rectangle for entry |
| 15M | Entry Trigger | ChoCH after OB/FVG touch, 15M BOS in trade direction | Exact entry candle and timing |
| 5M | Precision (Advanced) | Micro structure shift for tighter stop placement | Entry refinement only — not used by beginners |
Trying to use one timeframe for everything. Beginners find a 15M Order Block, determine their bias from that same 15M chart, target a 15M liquidity pool, and wonder why their win rate is poor. SMC only works when the higher timeframe structure provides the context — and the lower timeframe provides the entry. Never analyze and enter on the same timeframe.
11. The 3 Conditions Every SMC Trade Must Meet
This is the filter that separates high-probability setups from noise. Before executing any SMC trade, all three conditions must be true simultaneously:
-
CONDITION 1
Higher Timeframe Structure Alignment. The trade direction must be in alignment with the nearest higher timeframe structure. Long trades only when the 4H or Daily is making Higher Highs and Higher Lows. Short trades only in confirmed downtrend structure. If there is conflict between timeframes, the higher timeframe wins — or you wait.
-
CONDITION 2
A Liquidity Pool Has Been Identified in the Trade Direction. You must know where price is going before you enter. A trade without a defined target — based on a visible, unmitigated liquidity pool — is speculation, not SMC. The target must be at minimum a 1:2 risk-reward distance from your entry to be worth taking.
-
CONDITION 3
Lower Timeframe Confirmation at the Entry Zone. Price entering an Order Block is not enough. You must see a structural shift on the lower timeframe — a ChoCH followed by a small BOS in the direction of the trade — before entering. This confirmation eliminates the majority of false entries that trap traders who anticipate instead of react.
📌 The Complete Framework — Summary
- Market Structure (HH/HL or LH/LL) establishes your directional bias. The higher the timeframe, the more powerful the structure. Never trade against Daily structure with 15M setups.
- Break of Structure (BOS) confirms the trend is continuing. Use it to re-enter on pullbacks with high conviction. A BOS in the opposite direction after a ChoCH confirms a trend reversal.
- Change of Character (ChoCH) is the first warning sign that the trend is ending — the first violation of the most recent swing. It is a warning, not yet a reversal signal. Wait for BOS confirmation.
- Fair Value Gaps (FVG) mark price imbalances that tend to get revisited before the move continues. The most powerful entries occur when an FVG sits inside an Order Block on the same timeframe.
- Order Blocks (OB) are the last opposing candle before a strong impulsive move — where institutional orders remain unfilled. They are your entry tool, not your bias tool. Only trade them in discount (for longs) or premium (for shorts) zones.
- Liquidity Pools are your targets. Price moves to collect retail stop losses above swing highs (BSL) and below swing lows (SSL) before reversing. Know your target before your entry.
- The complete trade: HTF structure for bias → Liquidity pool for target → 1H OB/FVG for entry zone → 15M ChoCH for trigger → Enter at OTE, SL below OB wick, TP at liquidity pool.
The Complete SMC Framework.
Now Running 24/7 — Without You.
You just read the entire Smart Money Concepts framework in one sitting. Most traders spend months trying to piece this together across dozens of YouTube videos, paid courses, and Discord servers. The framework is not complicated — but executing it flawlessly, on every setup, across every timeframe, 24 hours a day without emotional interference? That is where almost every manual SMC trader eventually fails.
MJW CryptoTrader Pro is built on exactly this framework — the same BOS, ChoCH, FVG, Order Block, and Liquidity Pool logic you just read — running autonomously on Binance Futures every hour of every day. It does not get tired. It does not revenge trade. It does not move stop losses. It does not miss setups at 3 AM. It executes the framework as described, every time, with the same discipline that no manual trader can consistently maintain. That discipline is the edge.