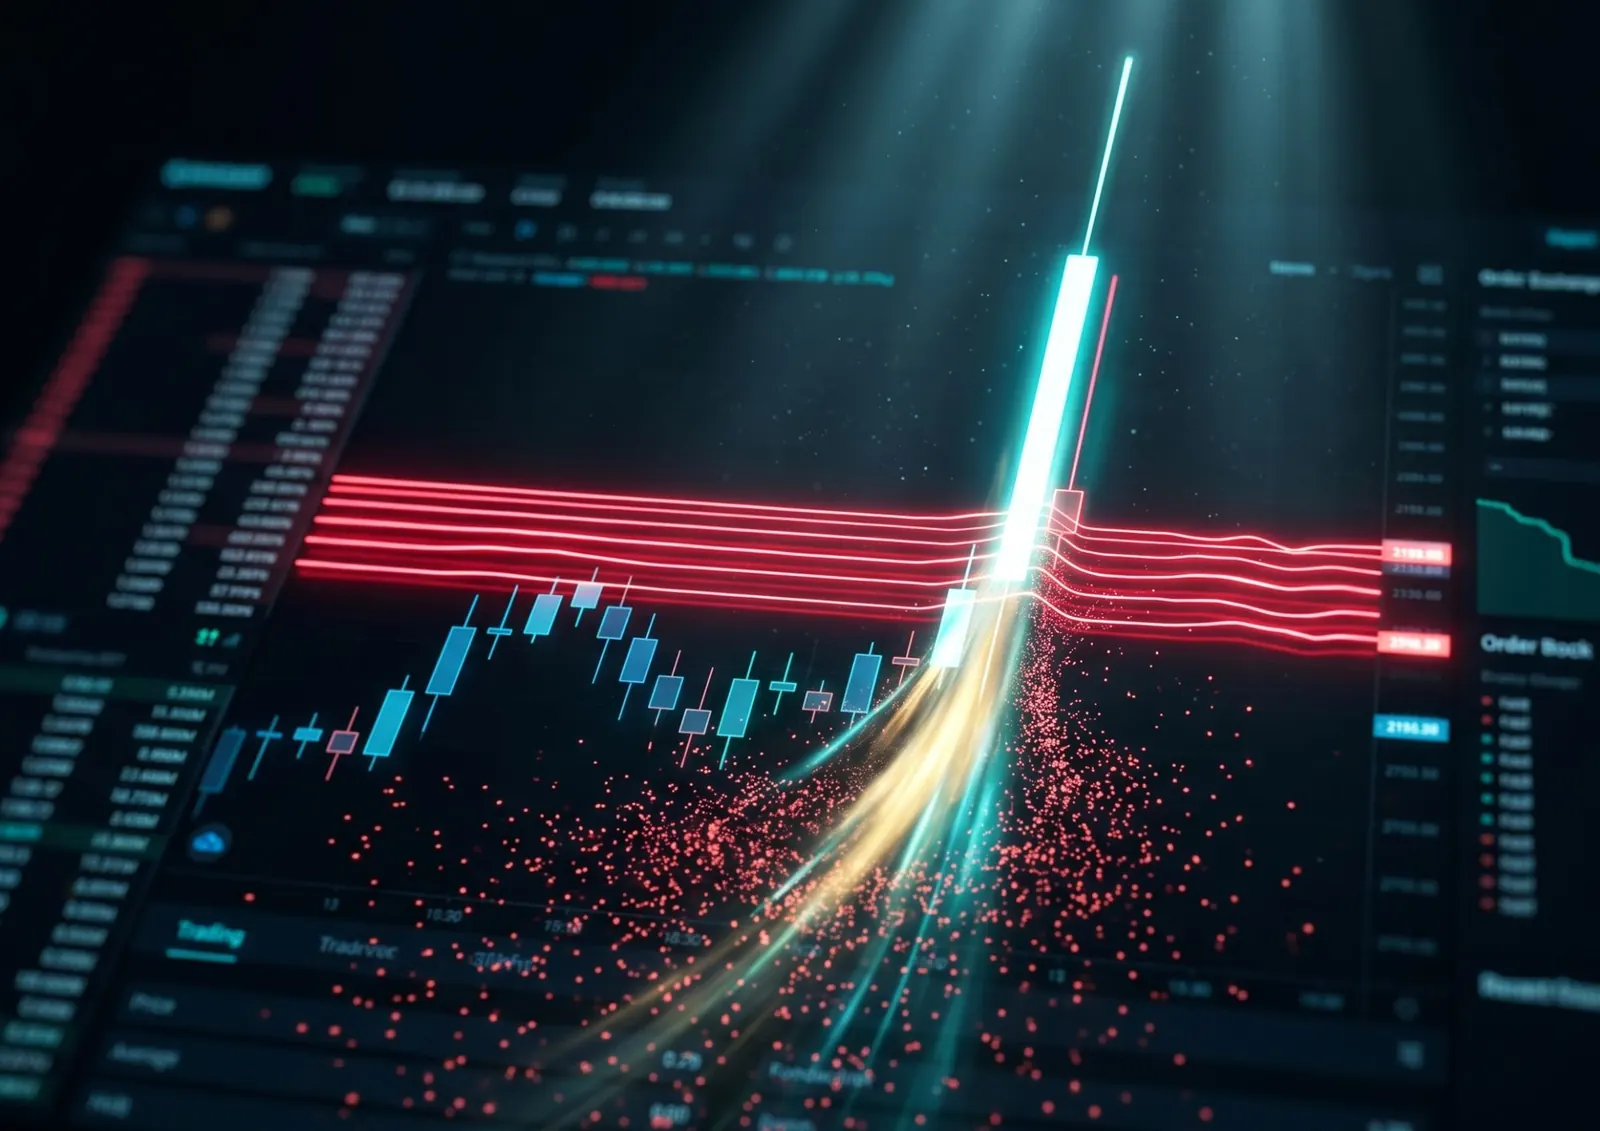
You set a stop-loss at a logical level. Price dips exactly to that level, triggers your stop, then immediately reverses and goes to your original target — without you. You lose. The market profits. And it feels personal.
It is not personal. But it is absolutely not random either. What just happened to you has a name: a liquidity sweep. And it happens to thousands of retail traders simultaneously, every single day, across every major crypto market. Understanding why it happens — and how to stop being the victim — is one of the most important shifts you can make as a trader.
1. The Problem Institutions Have — And Why Your Stop Is the Solution
To understand liquidity sweeps, you first need to understand the fundamental problem that large institutions face every single time they want to enter a trade.
Institutions do not trade $500. They trade $500 million. And when you want to buy $500 million worth of Bitcoin, you cannot just click "market buy" — because there are not enough willing sellers at the current price to fill your order without pushing price up dramatically against yourself. You need a massive pool of sell orders to buy from.
Imagine you want to buy 10,000 concert tickets at face value. But the venue only has 200 seats available at face value. To get the other 9,800 tickets, you need scalpers to panic-sell their tickets cheaply. How do you make scalpers panic? You spread a rumor that the concert is cancelled. They dump their tickets in fear. You sweep in and buy all 10,000 at face value. Then you announce the concert is back on. Price goes back up. You just engineered your own entry using other people's panic.
In trading, your stop-loss order is a pending sell order sitting in the market. Retail traders reliably cluster their stops at the same obvious places: just below recent lows, just above recent highs, at round numbers like $60,000 or $70,000. Institutions know this. And they use it.
2. What a Liquidity Sweep Actually Is — Step by Step
A liquidity sweep is a deliberate price move through a known level where retail stop-losses cluster, designed to trigger those stops and create the sell-order pool institutions need to fill their buy positions — before reversing sharply upward.
-
PHASE 01
Accumulation. Price ranges quietly for a period of time. Retail traders observe the range, identify the "support" at the bottom, and place stop-losses just below it. Thousands of traders do this simultaneously. A massive pool of sell orders builds up — invisible, waiting, just below that support level.
-
PHASE 02
The Push. Smart Money pushes price down through the support level — just far enough to trigger the cluster of stop-losses. This looks like a "breakdown" to retail traders who aren't in the trade yet, so some also open new short positions. The sell-order pool grows even larger.
-
PHASE 03
The Sweep. Institutions absorb all those sell orders with their massive buy orders. Every stop-loss that triggered? That is a sell order that an institution just bought from. In seconds, the entire pool of liquidity is consumed. The wick appears on the chart — a sharp spike down with almost no candle body.
-
PHASE 04
The Reversal. With the liquidity pool exhausted and institutions now fully positioned long, price has nothing left to push it down. It reverses sharply upward. Retail traders who were stopped out watch in disbelief. Traders who shorted the "breakdown" get squeezed. The real move begins.
The stop-loss that got triggered was not a mistake on your part. Your level was probably correct. The institution needed you to sell at exactly that level so they could buy from you. Your stop-loss order was literally their entry order. Once you understand this, charts never look the same again.
3. Liquidity Sweep vs. Stop Hunt vs. Liquidity Grab — The Differences
These three terms are often used interchangeably, but they describe slightly different things. Here is the clear breakdown:
| Term | What It Describes | Scope | Aftermath |
|---|---|---|---|
| Liquidity Sweep | The full sequence: push through level → collect orders → reverse | Broad — includes the reversal | Strong directional move opposite to the sweep |
| Stop Hunt | The specific act of triggering retail stop-losses | Narrow — the triggering moment only | Part of the sweep; reversal follows |
| Liquidity Grab | A fast, surgical move to a specific level and back | Short-term, focused on one tight zone | Quick reversal — often within minutes |
Think of it this way: the stop hunt is the trap being set. The liquidity sweep is the entire operation including the escape. The liquidity grab is the same concept but faster and more surgical. In practice, treat them all the same way — wait for confirmation before entering.
4. Where Liquidity Sweeps Happen — The Six Hunting Grounds
Sweeps do not happen randomly. They target specific price levels where retail stop-losses predictably cluster. These are the six most common zones:
Swing Highs & Lows
The most common sweep zone. Every time Bitcoin makes a swing high, retail traders place stop-losses just above it (if short) or swing lows for stops below (if long). Multiple tests of the same level add more stops each time.
Round Numbers
$60,000, $70,000, $100,000 — psychologically important levels attract massive stop clusters. Institutions know exactly where they sit. These round levels are swept more frequently than any other zone in crypto.
Previous Day/Week High & Low
Textbook technical analysis teaches traders to use previous session highs and lows. Institutions know this too. PDH and PDL are some of the highest-probability sweep targets on the 4H and daily timeframes.
Trendline Touchpoints
Ascending trendlines attract long-biased stops just below them. Every time price bounces off a trendline, more traders place stops under it. By the third or fourth touch, enough stops have accumulated for a worthwhile sweep.
Equal Highs & Equal Lows
When price creates two or more highs or lows at exactly the same level, retail traders see "strong resistance" or "strong support." In SMC, these are called EQH/EQL — and they are primary sweep targets.
Liquidation Clusters (Crypto-Specific)
On crypto perpetual futures, leveraged positions create liquidation levels visible on liquidation heatmap tools. Institutions can see exactly where $50M or $100M in leveraged long liquidations sit and sweep directly into them.
5. How to Identify a Liquidity Sweep on a Chart — Visual Clues
Once you know what to look for, sweeps become obvious in hindsight — and increasingly identifiable in real time. Here are the three visual signatures:
-
CLUE 01
Long wick with small body. The candle pierces a known level but the body closes back inside the prior range. This is the single most reliable visual confirmation of a sweep. A genuine breakout has a large body that closes beyond the level.
-
CLUE 02
Spike in volume during the wick. Liquidity sweeps often show a sudden volume spike at the wick — because thousands of stop-loss orders are being filled simultaneously. Volume explodes as institutions absorb all that liquidity in seconds.
-
CLUE 03
Sharp reversal immediately after. Price does not consolidate below the level. It snaps back instantly. The reversal is often equal in speed and momentum to the sweep itself. Slow, grinding price action after a level break is usually a real breakout, not a sweep.
Ask yourself one question after price breaks a level: did the candle body close beyond the level? Body closes beyond = possible real breakout. Body closes back inside = liquidity sweep. This single test eliminates most false entries and keeps you on the right side of the move.
6. The Correct Way to Trade a Liquidity Sweep in 2026
Here is the critical mistake most traders make after learning about sweeps: they try to enter at the exact moment of the wick. In 2026's market — full of AI bots and high-frequency algorithms — that is too risky. The fix is simple: wait for confirmation.
The confirmation is called a Market Structure Shift (MSS) — a lower-timeframe break of structure that proves the sweep is complete and the reversal is genuinely underway.
-
STEP 01
Identify the liquidity zone. Mark swing highs, swing lows, equal highs/lows, and round numbers on the 1H or 4H chart. These are your sweep targets. Wait — don't trade yet.
-
STEP 02
Watch for the sweep. Price approaches the zone. If it pierces it with a wick (body closes back inside), the sweep is likely happening. Still don't enter yet.
-
STEP 03
Drop to a lower timeframe (1M or 5M) and wait for MSS. After a sell-side sweep (below a low), you need price to break a recent small high on the 1M chart, proving buyers have taken control. After a buy-side sweep (above a high), wait for price to break a recent small low.
-
STEP 04
Enter on the MSS confirmation with a stop-loss placed below the sweep wick (not below the original level). This gives you a tighter stop and much better risk-to-reward. Target the next major liquidity zone on the opposite side.
Sweep alone = 50/50 guess. Sweep + MSS confirmation = high-probability entry. You give up the absolute perfect entry, but you cut your false-signal rate dramatically. Across 100 trades, that trade-off saves real capital. This is the same confluence principle behind Order Block entries — a full picture of how these pieces fit together is in our complete Smart Money Concepts guide.
7. Retail Behavior vs. Smart Money Behavior — Side by Side
- Places stop just below obvious support or swing low
- Buys breakouts the moment price breaks a high
- Sells breakdowns the moment price breaks a low
- Treats the wick as the direction signal
- Enters immediately when "confirmation" candle appears
- Places stops at the same obvious levels as every other retail trader
- Identifies where retail stops are clustered
- Engineers a move into that zone to trigger those stops
- Absorbs all the sell orders with buy orders
- Waits for the liquidity to be consumed before reversing
- Enters only after the stop pool is cleared
- Places stops beyond the sweep level — where retail entries are not
8. Why Crypto Is Especially Vulnerable to Liquidity Sweeps
Liquidity sweeps happen in all markets — forex, stocks, gold, indices. But crypto is uniquely susceptible for three structural reasons:
-
REASON 01
Extreme leverage culture. Most crypto exchanges offer up to 100x leverage. A 1% price move wipes out a 100x leveraged position completely. This means stop-losses must be placed incredibly close to entry — making them trivially easy to sweep without large price movements.
-
REASON 02
Liquidation heatmaps are public. On perpetual futures markets (Binance, Bybit, Hyperliquid), liquidation levels for leveraged positions are visible through public tools. Institutions and sophisticated bots can see exactly where $50M, $100M, or $500M in forced liquidations sit — and target those zones precisely.
-
REASON 03
Lower regulation. In equity markets, regulators monitor and restrict certain forms of price manipulation. In crypto, the regulatory framework is still evolving. Large coordinated moves that would be scrutinized in stocks can execute freely in crypto — especially during low-liquidity hours (Asian session, weekends).
Sweeps are most frequent and most reliable at session opens (London 8:00 AM GMT, New York 1:30 PM GMT) and immediately before major news events (FOMC, CPI, NFP). Institutions use the low liquidity of the Asian session to build the wick, then let the London session provide the momentum for the reversal. Trade the London and New York sessions — not the Asian session — for cleaner sweep confirmations.
📌 Key Takeaways
- Liquidity sweeps are not random. They are deliberate, calculated moves designed to trigger retail stop-losses and create the order flow institutions need to fill large positions — the manipulation phase of the market maker model.
- Your stop-loss is their entry order. The level you chose was probably correct. Institutions needed you to sell at exactly that point so they could buy from you at scale.
- The six primary sweep zones are swing highs/lows, round numbers, PDH/PDL, trendline touchpoints, equal highs/lows, and crypto-specific liquidation clusters.
- The visual signature of a sweep is a long wick with a small body that closes back inside the prior range — not a candle body that closes beyond the level (that is a breakout).
- Never enter at the wick. Wait for a Market Structure Shift (MSS) on a lower timeframe to confirm the reversal before entering. Sweep + MSS = high-probability setup.
- Crypto is especially vulnerable due to leverage culture, public liquidation heatmaps, and lighter regulation — making sweeps more frequent and more mechanical than in other markets.
You Now Know How the Trap Works.
MJW CryptoTrader Pro Was Built to Avoid It.
Most trading bots fail for the same reason retail traders fail — they place entries at obvious levels where stop hunts happen. MJW CryptoTrader Pro is built differently.
Our algorithm is built on Smart Money Concepts — the same institutional logic you just read about. It identifies liquidity zones before price reaches them, waits for the sweep to complete, then enters only after Market Structure Shift confirmation. It does not chase breakouts. It does not place stops at obvious levels. It trades the way institutions trade.
24 hours a day. 7 days a week. On BTC/USDT futures. Zero emotion. Zero FOMO. Backtested across 3,214 trades.