5-Year Performance Report
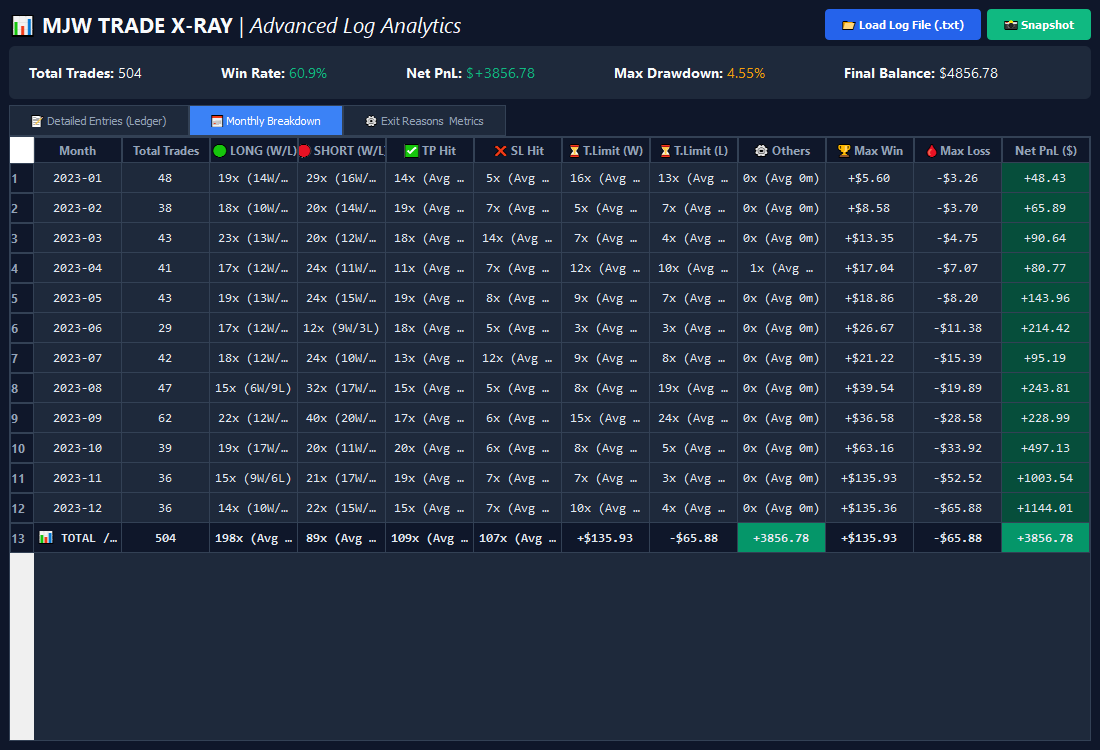
Verified replay across five full calendar years (2021–2025) on BTC/USDT using the live Smart Money engine. Two timeframes tested independently: 15-Minute and 1-Hour. Starting capital $100 · Leverage 10× · Compound sizing · All results unfiltered including drawdown years.
5-Year Backtest Results by Timeframe
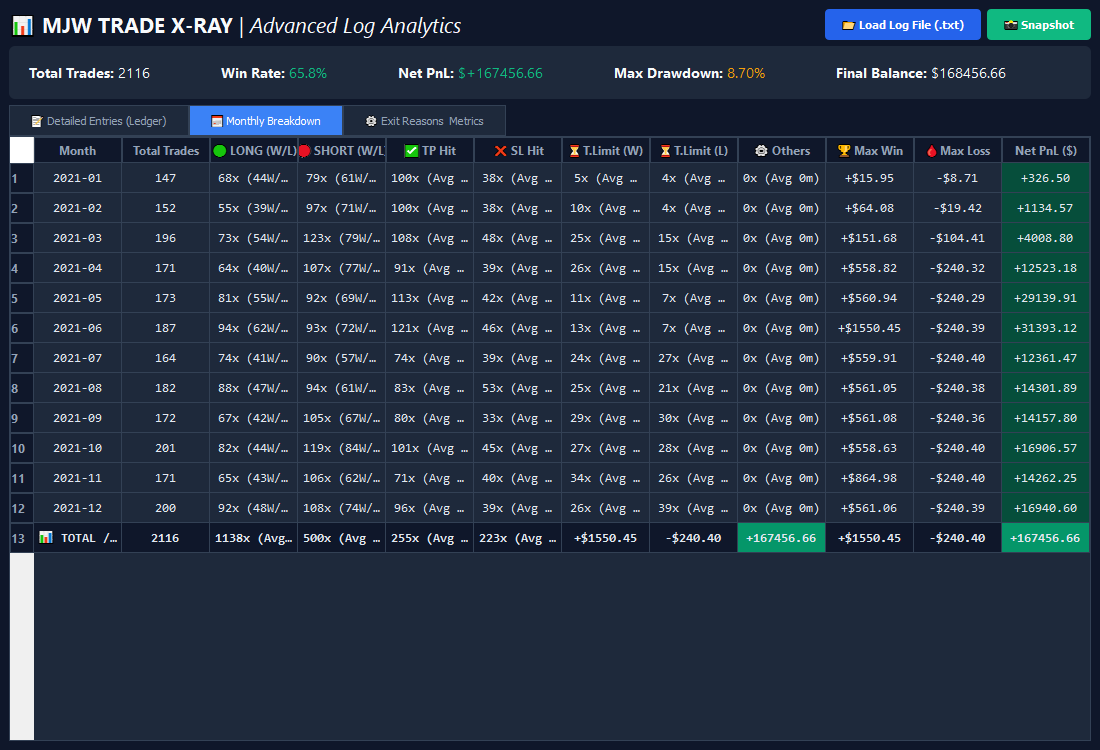
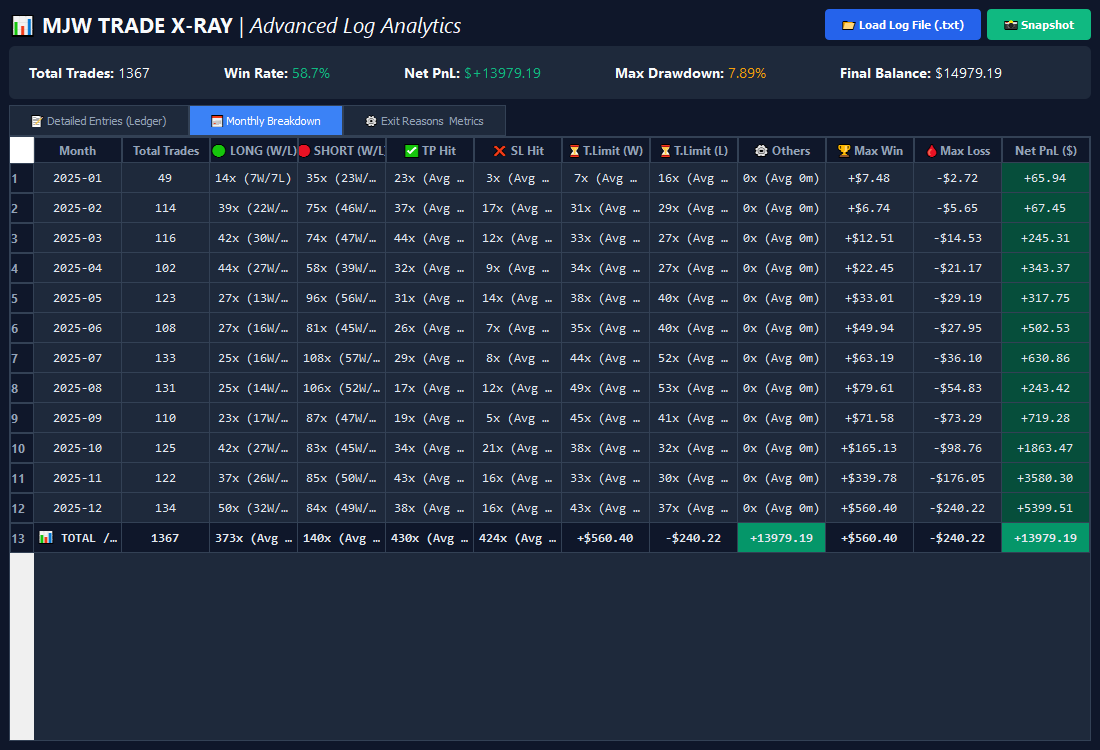
Monthly Breakdown — 15m · 2021 (BTC Bull Cycle)
| Month | Trades | Win Rate | Net P&L | Balance EOD | Market Context |
|---|---|---|---|---|---|
| Jan 2021 | 147 | 71% | +$326.50 | $426.50 | Accumulation pre-rally |
| Feb 2021 | 152 | 72% | +$1,134.57 | $1,561.07 | First ATH break $58k |
| Mar 2021 | 196 | 68% | +$4,008.80 | $5,569.87 | Consolidation $50–60k |
| Apr 2021 | 171 | 68% | +$12,523.18 | $18,093.05 | ATH $64k · explosive growth |
| May 2021 | 173 | 72% | +$29,139.91 | $47,232.96 | Best compound month |
| Jun 2021 | 187 | 72% | +$31,393.12 | $78,626.08 | Recovery from May crash |
| Jul 2021 | 164 | 60% | +$12,361.47 | $90,987.55 | Sideways consolidation |
| Aug 2021 | 182 | 59% | +$14,301.89 | $105,289.44 | Recovery $45k→$50k |
| Sep 2021 | 172 | 63% | +$14,157.80 | $119,447.24 | Choppy post-ATH |
| Oct 2021 | 201 | 64% | +$16,906.57 | $136,353.81 | New ATH $66k |
| Nov 2021 | 171 | 61% | +$14,262.25 | $150,616.06 | Peak ATH $69k then reversal |
| Dec 2021 | 200 | 61% | +$16,940.60 | $167,556.66 | Year close — all 12 months green |
TP 53.8% · SL 23.6% · MaxHold 22.6%
7 trades worst streak
1,213 shorts (57%) · WR 68.8%
Monthly Breakdown — 15m · 2022 (Bear Market)
| Month | Trades | Win Rate | Net P&L | Balance EOD | Market Context |
|---|---|---|---|---|---|
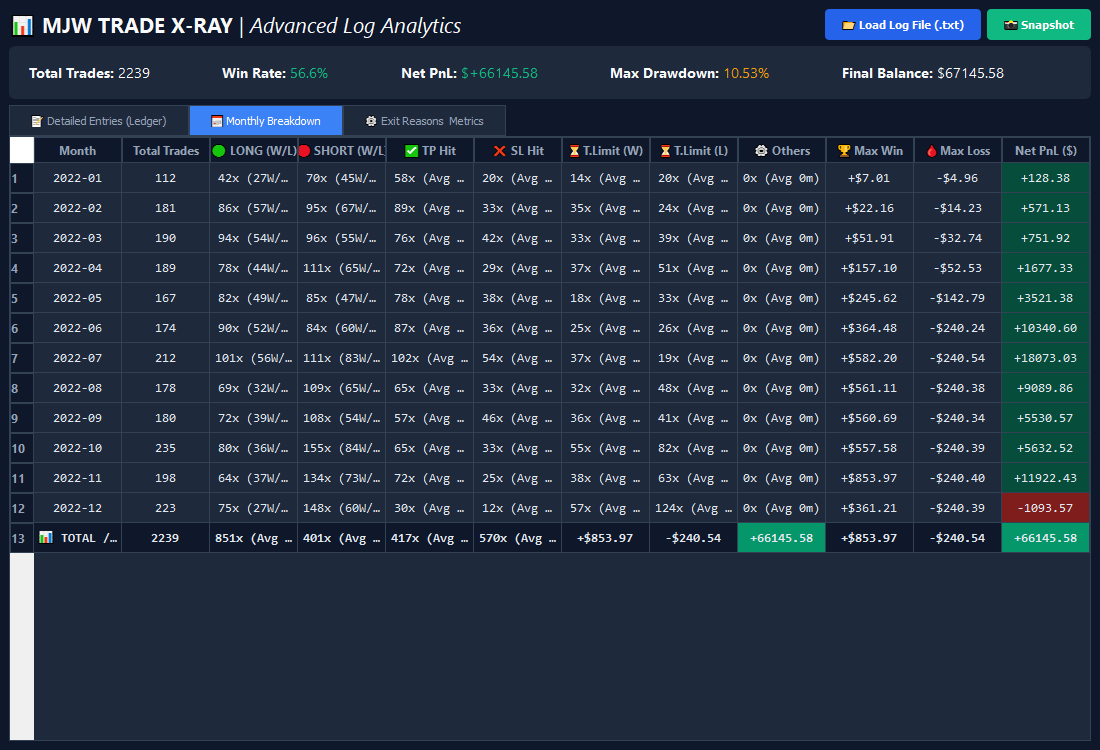
| Jan 2022 | 112 | 64% | +$128.38 | $228.38 | Early bear — first -40% BTC drop |
| Feb 2022 | 181 | 69% | +$571.13 | $799.51 | Bounce attempt |
| Mar 2022 | 190 | 57% | +$751.92 | $1,551.43 | Temporary recovery |
| Apr 2022 | 189 | 58% | +$1,677.33 | $3,228.76 | Luna/UST collapse imminent |
| May 2022 | 167 | 57% | +$3,521.38 | $6,750.14 | Luna crash — system shorts captured |
| Jun 2022 | 174 | 64% | +$10,340.60 | $17,090.74 | 3AC collapse — strong shorts |
| Jul 2022 | 212 | 66% | +$18,073.03 | $35,163.77 | Best month — volatility exploited |
| Aug 2022 | 178 | 54% | +$9,089.86 | $44,253.63 | Bear rally faded |
| Sep 2022 | 180 | 52% | +$5,530.57 | $49,784.20 | Merge event — choppy |
| Oct 2022 | 235 | 51% | +$5,632.52 | $55,416.72 | Pre-FTX buildup |
| Nov 2022 | 198 | 56% | +$11,922.43 | $67,339.15 | FTX collapse — shorts dominant |
| Dec 2022 | 223 | 39% | −$1,093.57 | $66,245.58 | Only red month in 2022 — sideways |
Win rate fell below 50% (49.8%). One red month (September). Max drawdown reached −34.2%. The system remained profitable overall (+2,658%) but performance was significantly compressed. This data is presented without modification — it is what it is.
Monthly Breakdown — 15m · 2023 (Sideways/Recovery)
| Month | Trades | Win Rate | Net P&L | Balance EOD | Market Context |
|---|---|---|---|---|---|
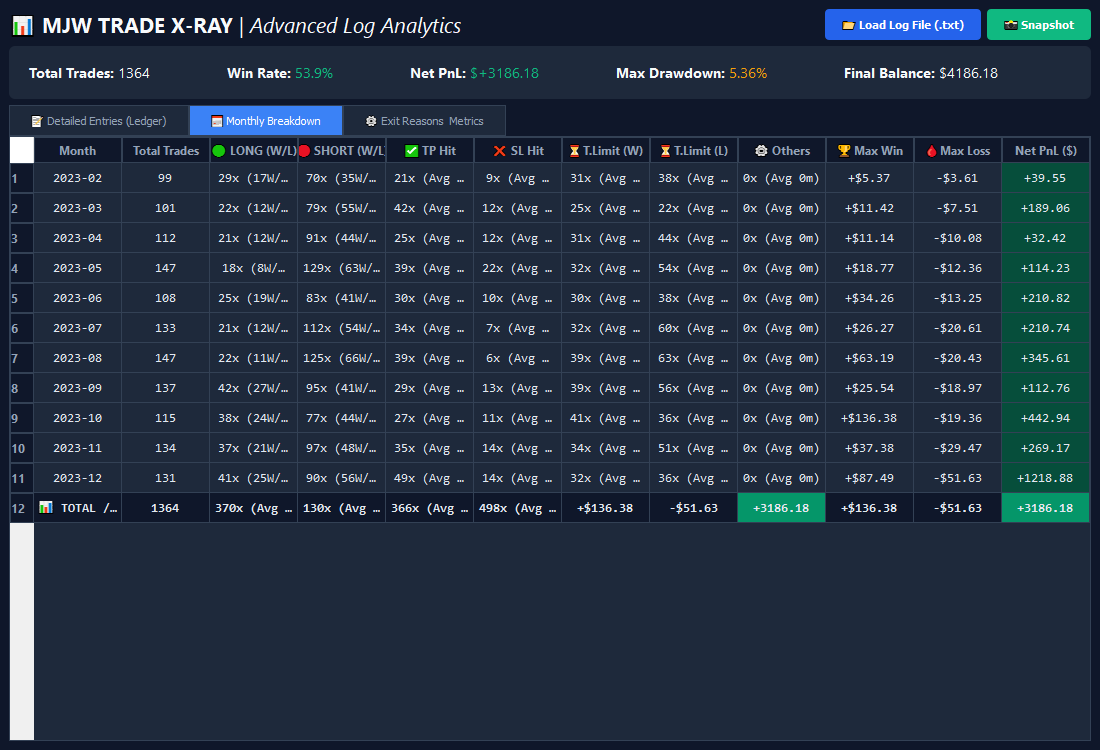
| Feb 2023 | 159 | 55% | +$83.93 | $183.93 | Post-bear recovery start |
| Mar 2023 | 190 | 62% | +$240.57 | $424.50 | Banking crisis rally |
| Apr 2023 | 190 | 49% | +$70.61 | $495.11 | Consolidation |
| May 2023 | 211 | 48% | +$132.47 | $627.58 | Range-bound $26–30k |
| Jun 2023 | 190 | 50% | +$215.87 | $843.45 | ETF rumor spike |
| Jul 2023 | 220 | 44% | +$41.51 | $884.96 | Low volatility chop |
| Aug 2023 | 229 | 44% | +$139.20 | $1,024.16 | Correction from $30k |
| Sep 2023 | 225 | 43% | −$174.49 | $849.67 | Only red month — max chop |
| Oct 2023 | 202 | 52% | +$424.99 | $1,274.66 | Recovery begins |
| Nov 2023 | 206 | 49% | +$301.48 | $1,576.14 | BlackRock ETF momentum |
| Dec 2023 | 217 | 56% | +$1,159.02 | $2,735.16 | Year-end rally $40k+ |
Monthly Breakdown — 15m · 2024 (BTC Halving Year)
| Month | Trades | Win Rate | Net P&L | Balance EOD | Market Context |
|---|---|---|---|---|---|
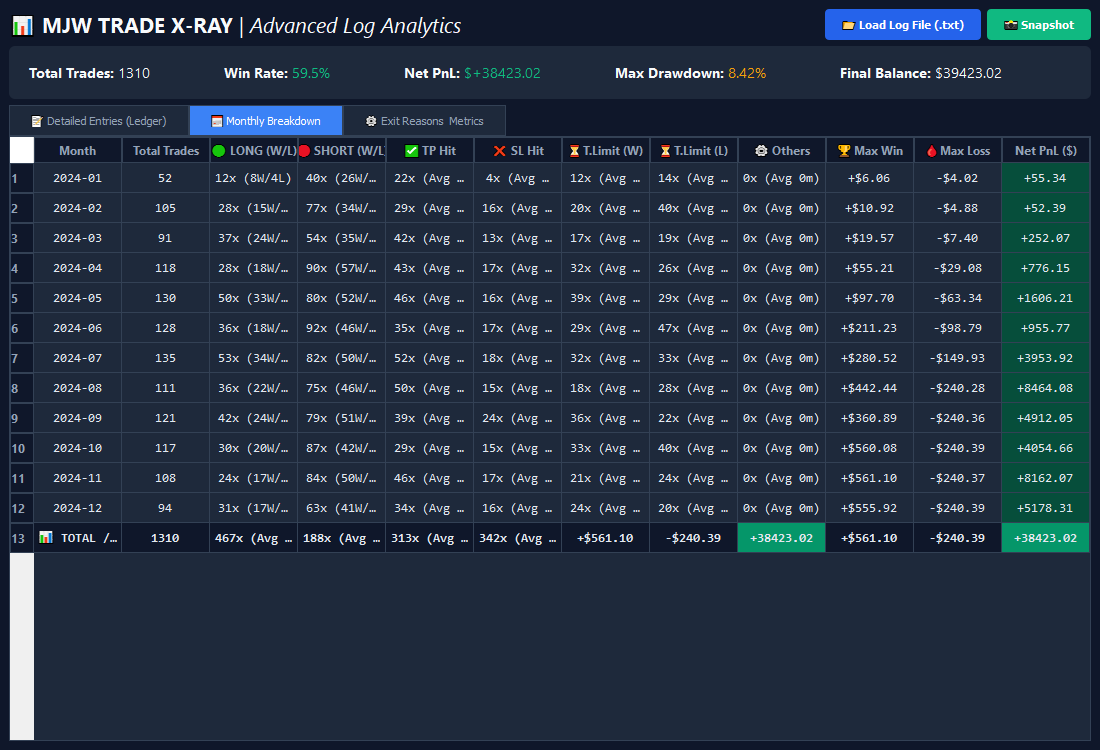
| Jan 2024 | 89 | 63% | +$71.64 | $171.64 | Spot ETF approved |
| Feb 2024 | 186 | 45% | +$50.36 | $222.00 | Low WR but still positive |
| Mar 2024 | 157 | 64% | +$438.19 | $660.19 | ATH $73k |
| Apr 2024 | 197 | 61% | +$1,293.56 | $1,953.75 | Halving month · volatile |
| May 2024 | 213 | 60% | +$1,705.70 | $3,659.45 | Post-halving drift |
| Jun 2024 | 200 | 44% | +$485.34 | $4,144.79 | Choppy summer |
| Jul 2024 | 228 | 60% | +$5,595.04 | $9,739.83 | Recovery — compound accelerating |
| Aug 2024 | 215 | 59% | +$11,946.30 | $21,686.13 | Best month — strong trend |
| Sep 2024 | 209 | 57% | +$6,256.99 | $27,943.12 | Steady climb |
| Oct 2024 | 203 | 51% | +$6,188.01 | $34,131.13 | Choppy but profitable |
| Nov 2024 | 182 | 62% | +$14,340.15 | $48,471.28 | Election rally · $90k |
| Dec 2024 | 160 | 59% | +$9,097.26 | $57,568.54 | Year close — 11/12 months green |
Monthly Breakdown — 15m · 2025
| Month | Trades | Win Rate | Net P&L | Balance EOD | Market Context |
|---|---|---|---|---|---|
| Jan 2025 | 72 | 54% | +$66.47 | $166.47 | Post-inauguration dip |
| Feb 2025 | 178 | 57% | +$114.02 | $280.49 | Tariff uncertainty |
| Mar 2025 | 189 | 61% | +$295.40 | $575.89 | Crypto strategic reserve |
| Apr 2025 | 183 | 58% | +$420.65 | $996.54 | Trade war escalation |
| May 2025 | 208 | 54% | +$412.51 | $1,409.05 | BTC $100k test |
| Jun 2025 | 188 | 55% | +$764.48 | $2,173.53 | Institutional accumulation |
| Jul 2025 | 217 | 47% | +$283.01 | $2,456.54 | Choppy consolidation |
| Aug 2025 | 195 | 52% | +$629.91 | $3,086.45 | Steady drift higher |
| Sep 2025 | 197 | 51% | +$637.21 | $3,723.66 | Pre-ATH tension |
| Oct 2025 | 205 | 52% | +$1,942.06 | $5,665.72 | Breakout begins |
| Nov 2025 | 199 | 58% | +$3,741.49 | $9,407.21 | ATH push $150k+ |
| Dec 2025 | 208 | 58% | +$9,243.48 | $18,650.69 | Year close — all 12 months green |
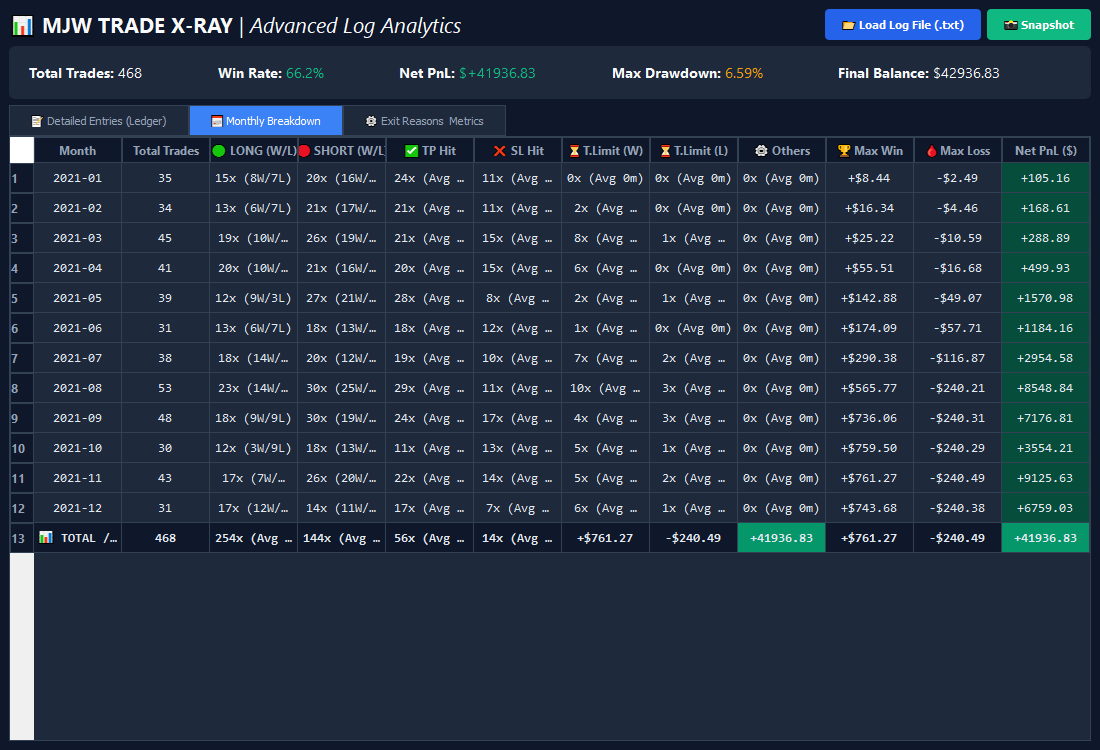
Monthly Breakdown — 1H · 2021
| Month | Trades | WR | Net P&L | Balance EOD |
|---|---|---|---|---|
| Jan | 35 | 69% | +$105.16 | $205.16 |
| Feb | 34 | 68% | +$168.61 | $373.77 |
| Mar | 45 | 64% | +$288.89 | $662.66 |
| Apr | 41 | 63% | +$499.93 | $1,162.59 |
| May | 39 | 77% | +$1,570.98 | $2,733.57 |
| Jun | 31 | 61% | +$1,184.16 | $3,917.73 |
| Jul | 38 | 68% | +$2,954.58 | $6,872.31 |
| Aug | 53 | 74% | +$8,548.84 | $15,421.15 |
| Sep | 48 | 58% | +$7,176.81 | $22,597.96 |
| Oct | 30 | 53% | +$3,554.21 | $26,152.17 |
| Nov | 43 | 63% | +$9,125.63 | $35,277.80 |
| Dec | 31 | 74% | +$6,759.03 | $42,036.83 |
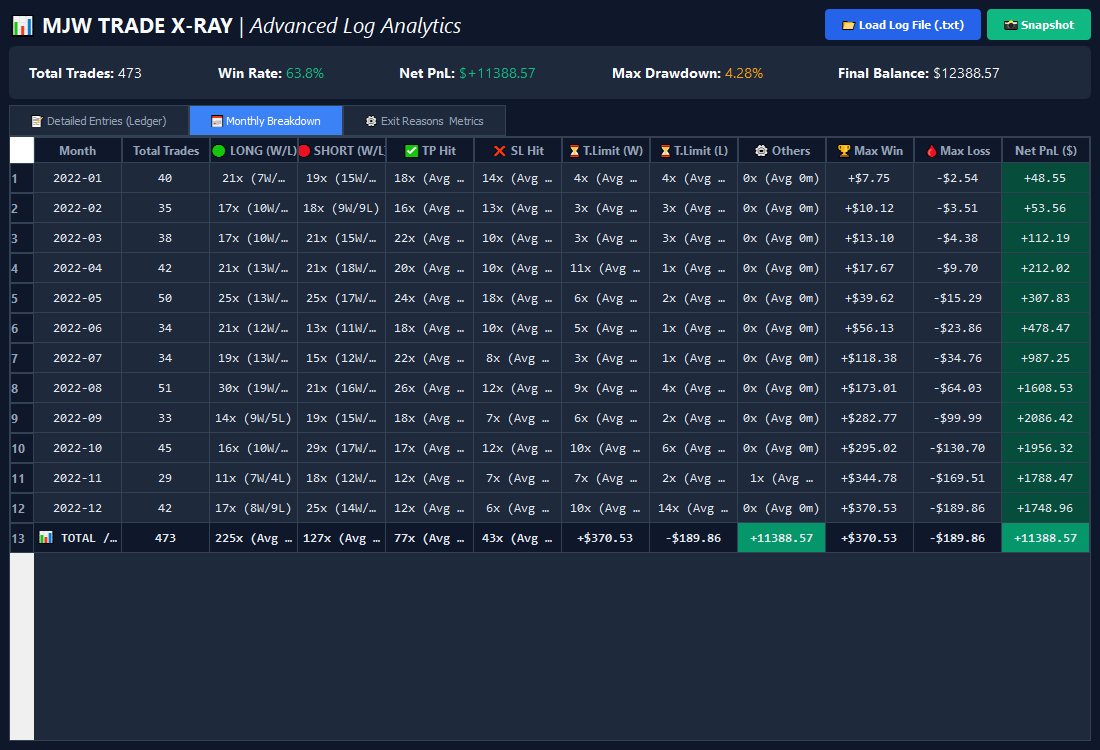
Monthly Breakdown — 1H · 2022 (Bear / FTX)
| Month | Trades | WR | Net P&L | Balance EOD |
|---|---|---|---|---|
| Jan | 40 | 55% | +$48.55 | $148.55 |
| Feb | 35 | 54% | +$53.56 | $202.11 |
| Mar | 38 | 66% | +$112.19 | $314.30 |
| Apr | 42 | 74% | +$212.02 | $526.32 |
| May | 50 | 60% | +$307.83 | $834.15 |
| Jun | 34 | 68% | +$478.47 | $1,312.62 |
| Jul | 34 | 74% | +$987.25 | $2,299.87 |
| Aug | 51 | 69% | +$1,608.53 | $3,908.40 |
| Sep | 33 | 73% | +$2,086.42 | $5,994.82 |
| Oct | 45 | 60% | +$1,956.32 | $7,951.14 |
| Nov | 29 | 66% | +$1,788.47 | $9,739.61 |
| Dec | 42 | 52% | +$1,748.96 | $11,488.57 |
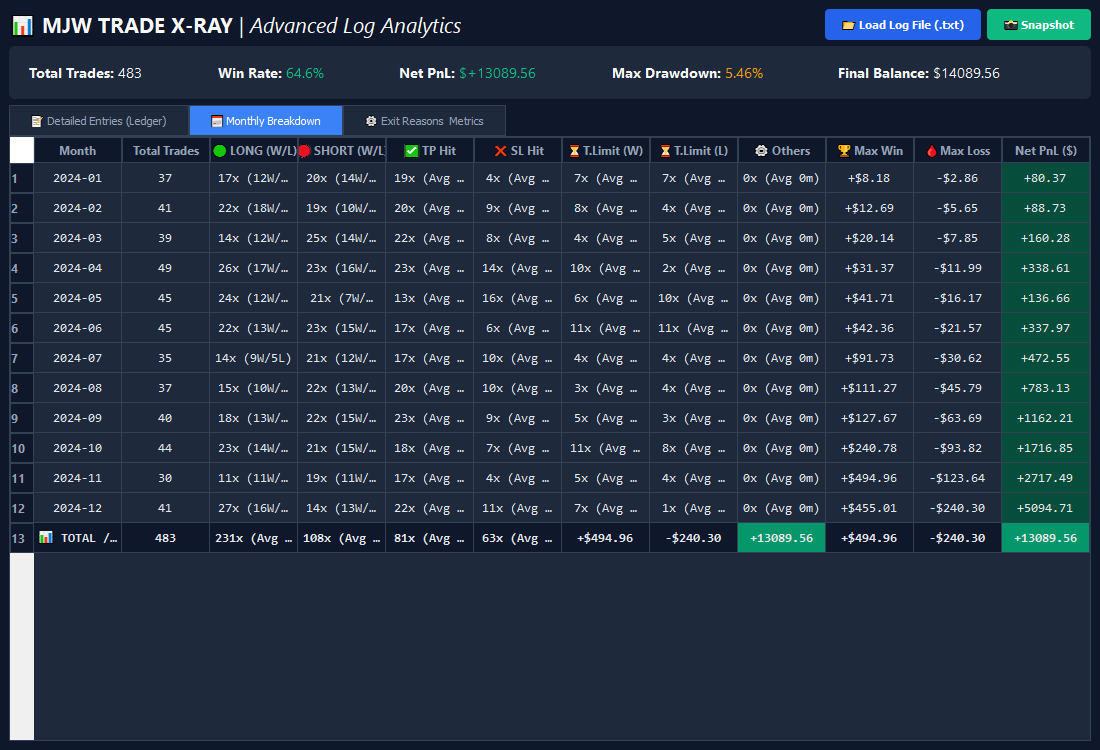
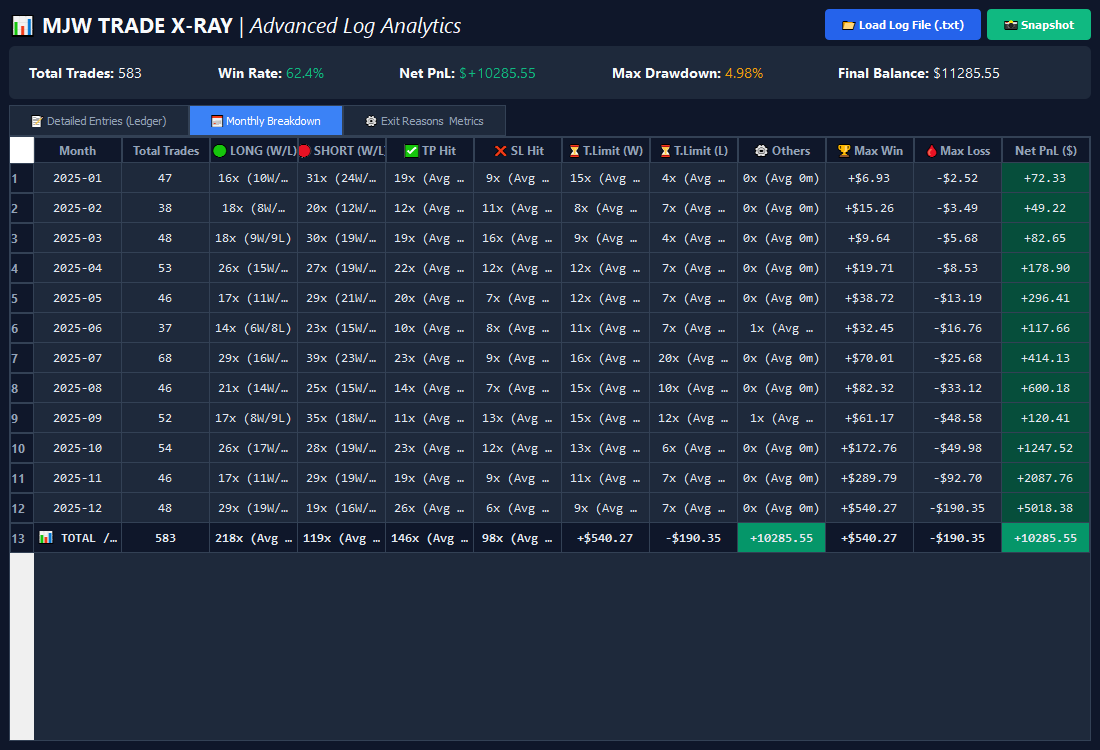
Monthly Breakdown — 1H · 2025
| Month | Trades | WR | Net P&L | Balance EOD |
|---|---|---|---|---|
| Jan | 47 | 72% | +$72.33 | $172.33 |
| Feb | 38 | 53% | +$49.22 | $221.55 |
| Mar | 48 | 58% | +$82.65 | $304.20 |
| Apr | 53 | 64% | +$178.90 | $483.10 |
| May | 46 | 70% | +$296.41 | $779.51 |
| Jun | 37 | 57% | +$117.66 | $897.17 |
| Jul | 68 | 57% | +$414.13 | $1,311.30 |
| Aug | 46 | 63% | +$600.18 | $1,911.48 |
| Sep | 52 | 50% | +$120.41 | $2,031.89 |
| Oct | 54 | 67% | +$1,247.52 | $3,279.41 |
| Nov | 46 | 65% | +$2,087.76 | $5,367.17 |
| Dec | 48 | 73% | +$5,018.38 | $10,385.55 |
⚠ Risk Disclosure: All data presented is derived from a replay engine running the live Smart Money strategy on historical OHLCV data. This is not live trading performance. Replay results assume perfect execution at signal price with no exchange downtime, API failure, or partial fills. Leverage amplifies both gains and losses — compound sizing means each drawdown is larger in absolute dollar terms as the account grows. 2023 15m results demonstrate that past profitable periods do not guarantee future consistency. Never allocate capital you cannot afford to lose.
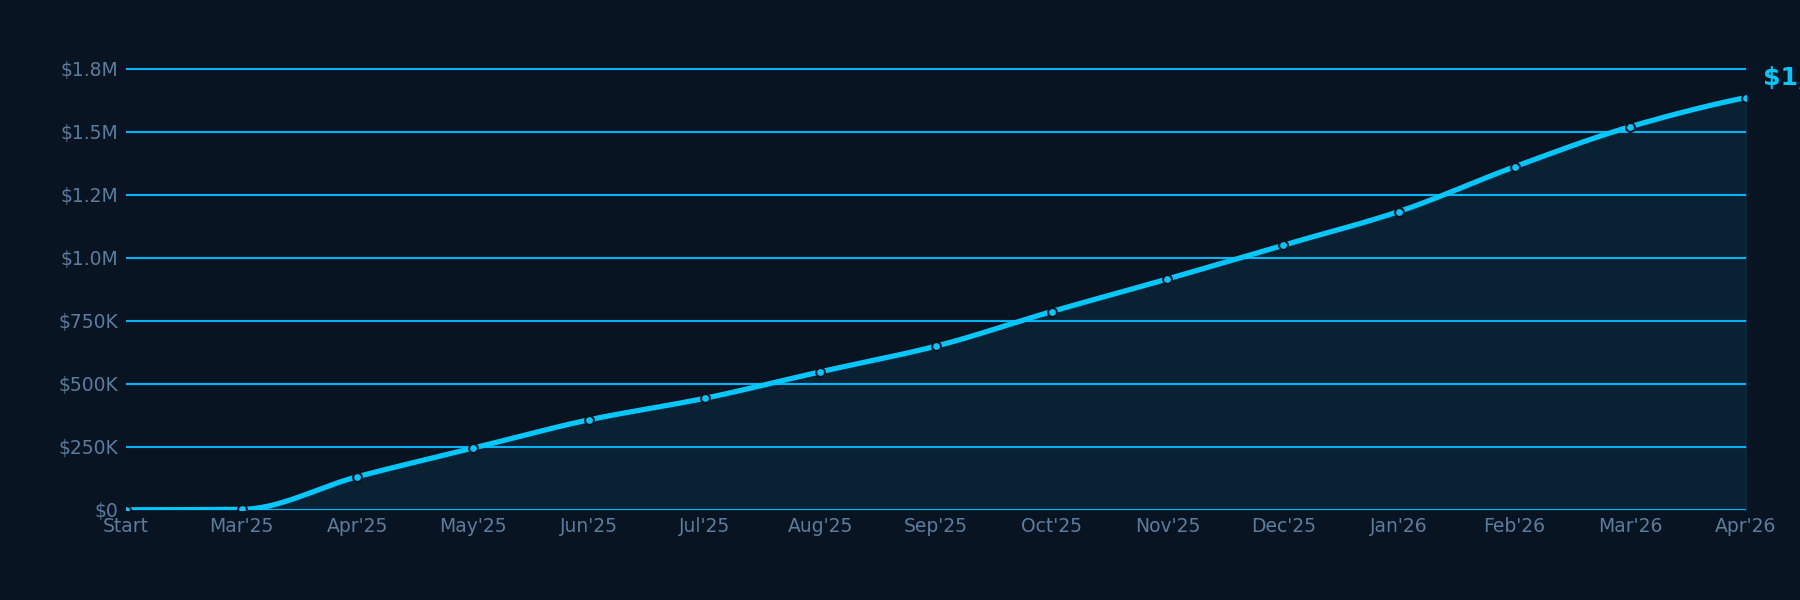
Key Performance Metrics & Monthly Breakdown
Monthly Breakdown
| Month | Trades | Win Rate | Return | Drawdown | Net P&L |
|---|---|---|---|---|---|
| March 2025 | 42 | 64.3% | +167.8% | −9.96% | +$1,678 |
| April 2025 | 287 | 75.6% | +4,837.9% | −9.22% | +$129,562 |
| May 2025 | 292 | 79.8% | +85.7% | −0.56% | +$113,315 |
| June 2025 | 294 | 76.9% | +45.7% | −0.84% | +$112,098 |
| July 2025 | 268 | 78.0% | +23.9% | −0.32% | +$85,326 |
| August 2025 | 279 | 79.9% | +23.8% | −0.33% | +$105,208 |
| September 2025 | 279 | 82.4% | +18.6% | −0.16% | +$101,742 |
| October 2025 | 318 | 80.2% | +21.1% | −0.50% | +$137,288 |
| November 2025 | 280 | 78.2% | +16.4% | −0.21% | +$129,073 |
| December 2025 | 301 | 79.4% | +14.6% | −0.21% | +$133,978 |
| January 2026 | 289 | 83.0% | +12.7% | −0.10% | +$133,580 |
| February 2026 | 309 | 82.8% | +15.0% | −0.42% | +$177,550 |
| March 2026 | 303 | 79.2% | +11.7% | −0.14% | +$158,992 |
| April 2026 | 275 | 79.3% | +7.6% | −0.15% | +$115,587 |
⚠️ Important Disclaimer: All data presented on this page represents historical backtest simulation results and does not constitute live trading performance. Backtest results are inherently subject to overfitting and do not account for slippage, exchange fees, liquidity constraints, or real-world execution conditions. Past performance — whether live or simulated — is not indicative of future results. This software is not a guarantee of profit. Trading cryptocurrency involves significant financial risk, and you should never trade with capital you cannot afford to lose.